Introduction
Discrete data are commonly used in forecasting models for better accuracy. Compare to the continuous variables like traffic flow or speed, the discrete variables (weather, POI, holidays) are always used as external information concatenated with the hidden output and pass through a linear layer.
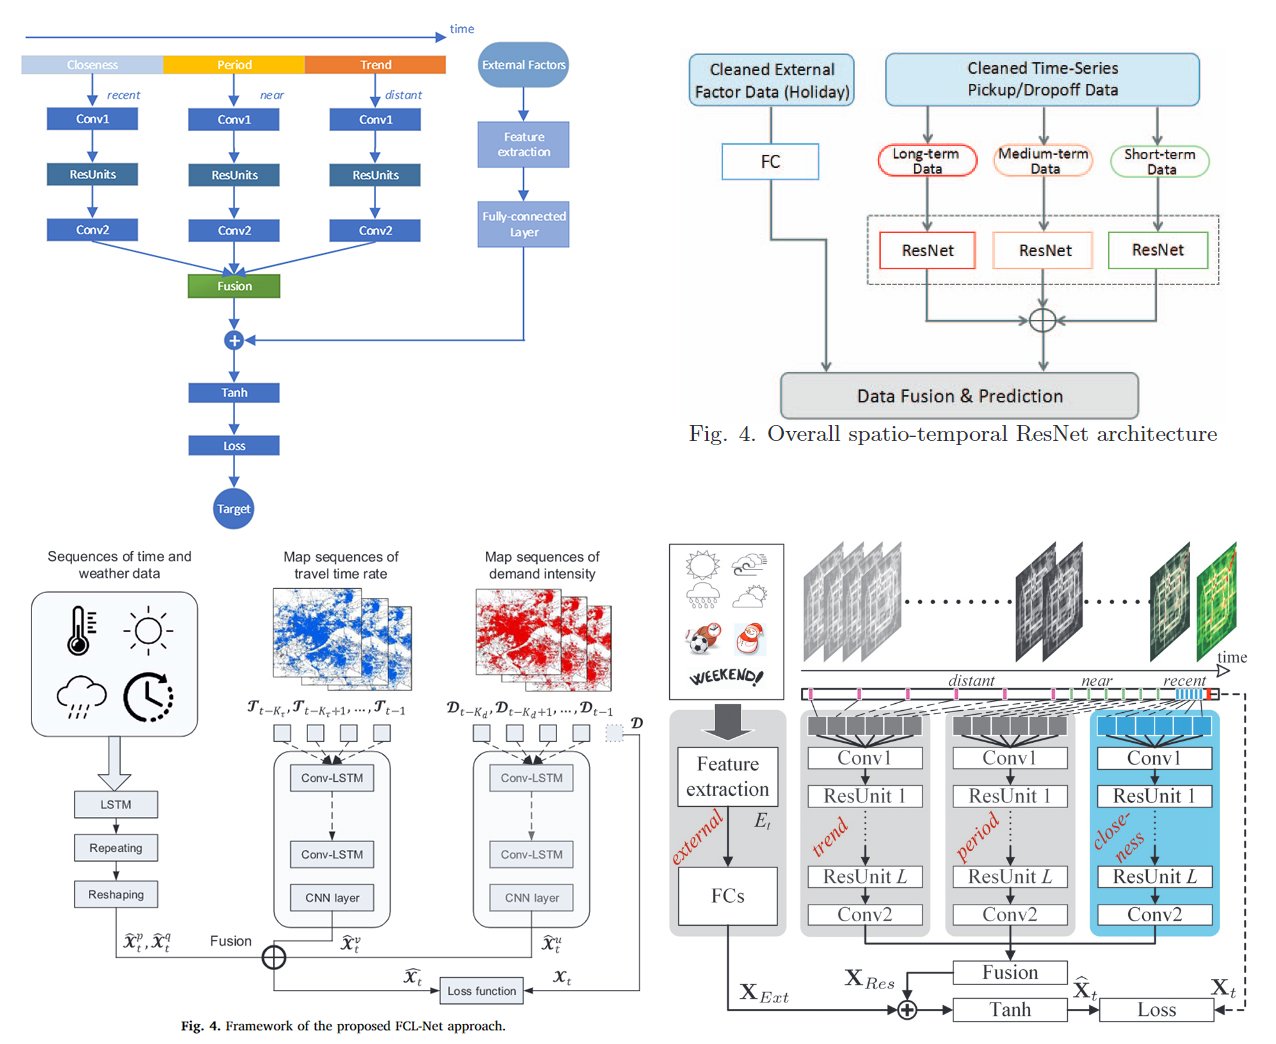
Some example of using external discrete data in traffic neural network models.
One-hot encoding
One-hot encoding is a common way to represent these discrete data. The figure below is an example of representing the amount of V cities.
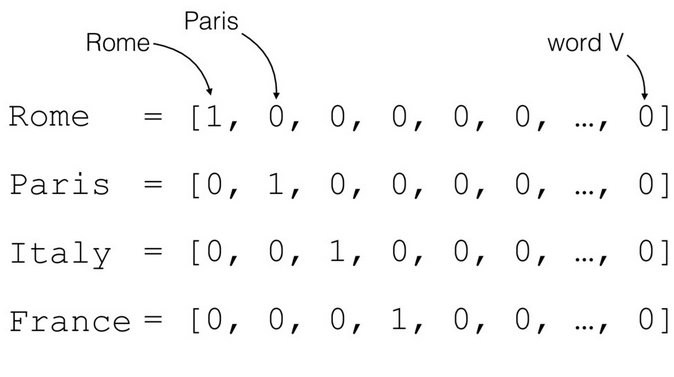
An example of one-hot encoding representing cities.
Every single city is encoded by a vector using 1 or 0. However, there are two defects with this method:
- The vector length impacted by the number of categories. For example, if we have 2,000 cities (V=2000), then the vector length would be 2,000.
- Since the information represented by 1 or 0 only, it’s hard to see the relationship between these categories.
Entity Embedding
An embedding is a mapping from discrete objects, such as words, to vectors of real numbers. For example, a 300-dimensional embedding for English words could include:
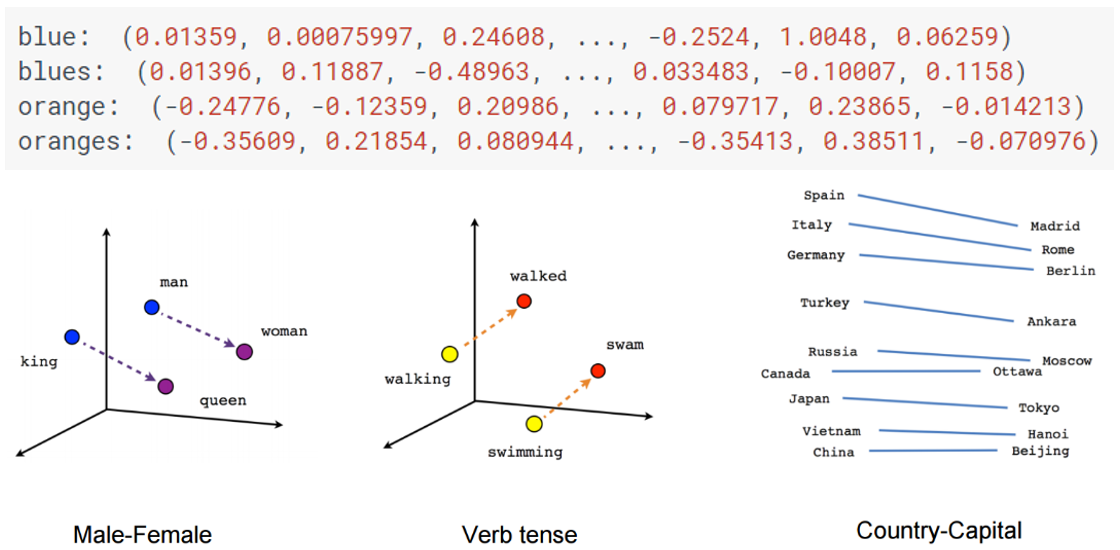
An example of word embedding. Source:https://www.tensorflow.org/guide/embedding
Unlike one-hot encoding, every value in a vector represents a dimension. The size of these vectors can be flexibly set. The embedding method can make the discrete variables more evenly distributed in a high-dimensional space, thus improving the training effect of the neural network model. Moreover, the trained embedding vectors can represent the relationship between different variables, which usually determined by the distance in space (see the word relation above). Generally, it uses the high dimensional latent space to represent the variable.
So, can we utilize this method in transport and analyze the internal relationship of these categorical variables?
Revealing the hidden features in traffic prediction
The basic idea is:
- Use only external discrete data as input to predict the traffic flow in the future.
- Analysis the hidden embedding layer after model training.
Dataset
Traffic FLow: Two-years station based bike-sharing data in Suzhou, China
Discrete Variables (Two-years):
-
Time related variables (Year, Month, Day, Hour, Day of the week)
-
Chinese Holidays (Mid-autumn festival, New year, Labor day, Weekend, National day, Working day, Chinese New Year, Tomb-sweeping Day, Dragon boat festival, Eve of Chinese New Year)
-
Meteorology (Air quality index, Weather description, Temperature, Wind and Humidity)
-
Station Information (Station ID, Transportation Service, Accommodation Service, Corporate Enterprise, Medical Care, Commercial Residence, Place Name & Address, Government Agencies & Social Organizations, Science, Education & Cultural Services, Shopping Service, Financial Insurance Services, Scenic Spots, Food & Beverages)
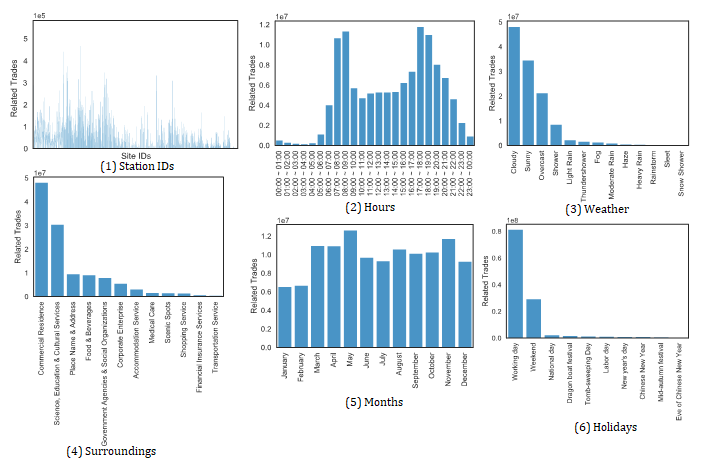
Traffic flow under different views (variables).
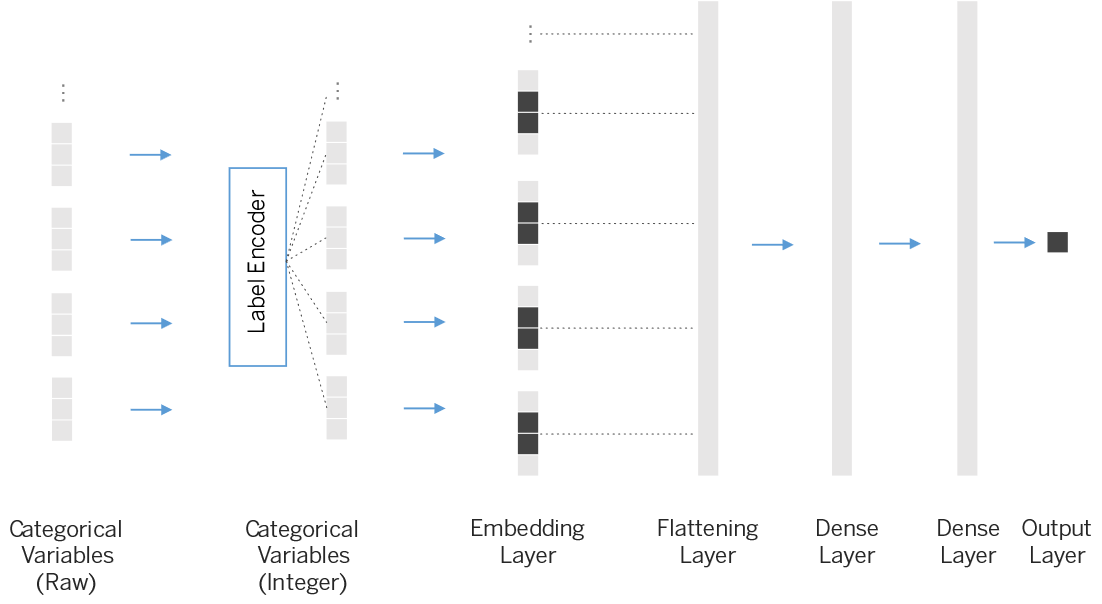
Model Structure
Visulization
After the training process, we will get the well trained high dimensional embedding weights.
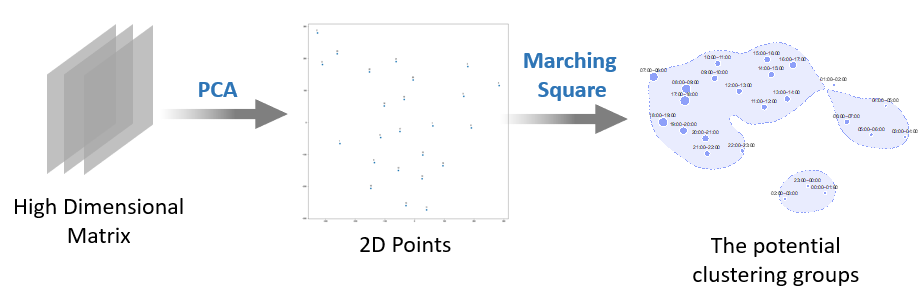
The visualization procedure is
- Use the PCA function to make dimensionality reduction and create a 2D plot.
- Use the Marching Squares function to drawing contours, which is the potential clustering group. ( can be done manually here as well)
Results

Visualization of station ID of 1,786 stations with four districts.
Part of the ID relation with names. See the full picture here to find more interesting relations:http://resuly.me/projects/embedding/.

Visualization of hours.
Conclusion
The results show that some of these discrete variables can be arranged in a reasonable way after being represented by trained embedding vectors, which also provide an important reference role for transport planning and traffic management. However, some variables like position, holidays didn’t show obvious aggregation. Many factors may cause this phenomenon, which still needs further study.
Codes
The code can be found at https://github.com/resuly/Traffic-Embedding.
If you think this is helpful to your research, please consider citing our work:
@article{wang2019revealing,
    title={Revealing the hidden features in traffic prediction via entity embedding},
    author={Wang, Bo and Shaaban, Khaled and Kim, Inhi},
    journal={Personal and Ubiquitous Computing},
    pages={1--11},
    year={2019},
    publisher={Springer}
}
Reference
Wang, B., Shaaban, K. and Kim, I., 2019. Revealing the hidden features in traffic prediction via entity embedding. Personal and Ubiquitous Computing, pp.1-11.
Xie, P., Li, T., Liu, J., Du, S., Yang, X. and Zhang, J., 2020. Urban flow prediction from spatiotemporal data using machine learning: A survey. Information Fusion.
Liao, S., Zhou, L., Di, X., Yuan, B. and Xiong, J., 2018, January. Large-scale short-term urban taxi demand forecasting using deep learning. In 2018 23rd Asia and South Pacific Design Automation Conference (ASP-DAC) (pp. 428-433). IEEE.
Ke, J., Zheng, H., Yang, H. and Chen, X.M., 2017. Short-term forecasting of passenger demand under on-demand ride services: A spatio-temporal deep learning approach. Transportation Research Part C: Emerging Technologies, 85, pp.591-608.
Zhang, J., Zheng, Y. and Qi, D., 2017, February. Deep spatio-temporal residual networks for citywide crowd flows prediction. In Thirty-First AAAI Conference on Artificial Intelligence.
Marching Squares Algorithm: https://en.m.wikipedia.org/wiki/Marching_squares
The plotting software: https://github.com/d3/d3-contour